Code in R
install.packages("NAMEOFPACKAGE")The data that we work with comes in many forms from many different sources. However, all of them can be easily imported into R, where they can be combined (if necessary) and analyzed. This resource covers the most common ways in which we can import data for our visualization purposes.
Note Some of these techniques will require you to install a package the first time that you try it out. The code for installing a package is as follows:
Static files are the easiest to input. As long as the file that you are entering into R is in the same folder as your project, you will not have to enter any long folder structure.
read_csv is a powerful function from the tidyverse package. Some extra features as follows:
skip - Number of lines to skip before reading data. This is useful if the file has a header that you don’t needcol_types - R, like Excel, will sometimes make a best guess at what type of data is being inputted. Unlike Excel, however, you can tell R what to do; this is most useful when you have numbers with a leading 0 that are supposed to be ID’s. In this case, if you input read_csv("FILENAME.csv", col_types="c"), it will make sure that all columns are first read in as characters (which you can convert to numbers later on)Here, we rely on the readxl package. Note that this call would read in the sheet of the Excel file called Sheet 1, would not skip any rows, and would read in each column as a text field.
R has its own specialized data type. While not useful externally, many of the internal scripts from the Research Team take advantage of this data type; it’s main strength is that you can save many files of different types as one RData file. For instance, you could save the dataframe and graph for a file in one place to share.
The call to load doesn’t require any library. It will automatically load the dataframes in the same way that they showed up in R before.
Reading Google Sheets into R is pretty easy thanks to the googlesheets4 package. We will use it to input the sample dataset found here.
If you need to, install the googlesheets4 package as follows.
Then, you should be able to read in the sheet as follows:
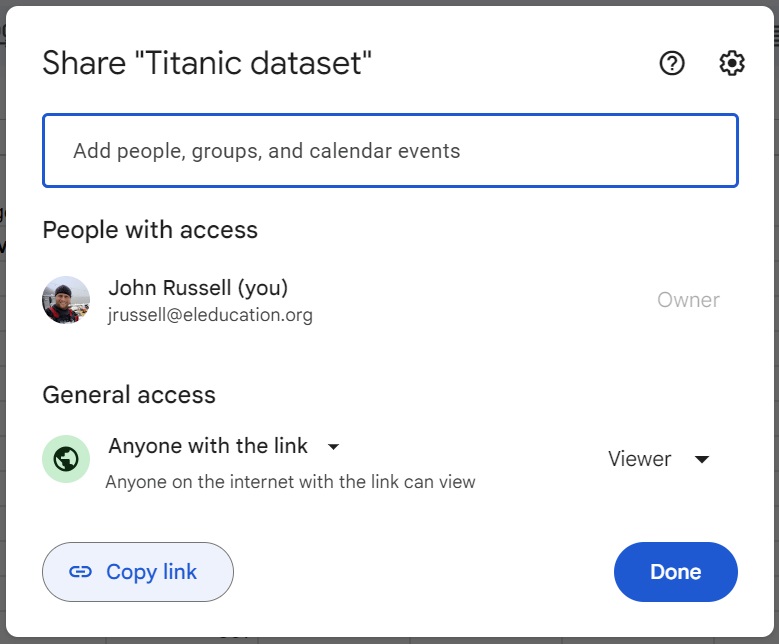
Look at the Share and Copy Link URL for the sheet.

Copy the link within the read_sheet function of googlesheets4. Example below will give you the titanic dataset.
Note that, when you run this, your console will ask you to authorize your Google account. Once you have done that, it will pull in the dataset in the background, and will store the credentials for future work in R.
In a similar manner to google sheets, gathering data from salesforce requires you to install a special package named salesforcer
Once you have done that, you’ll need to authenticate yourself to make sure that R knows who you are in salesforce. The easiest way to do that is to log into salesforce in your internet browser, and then run the following in R.
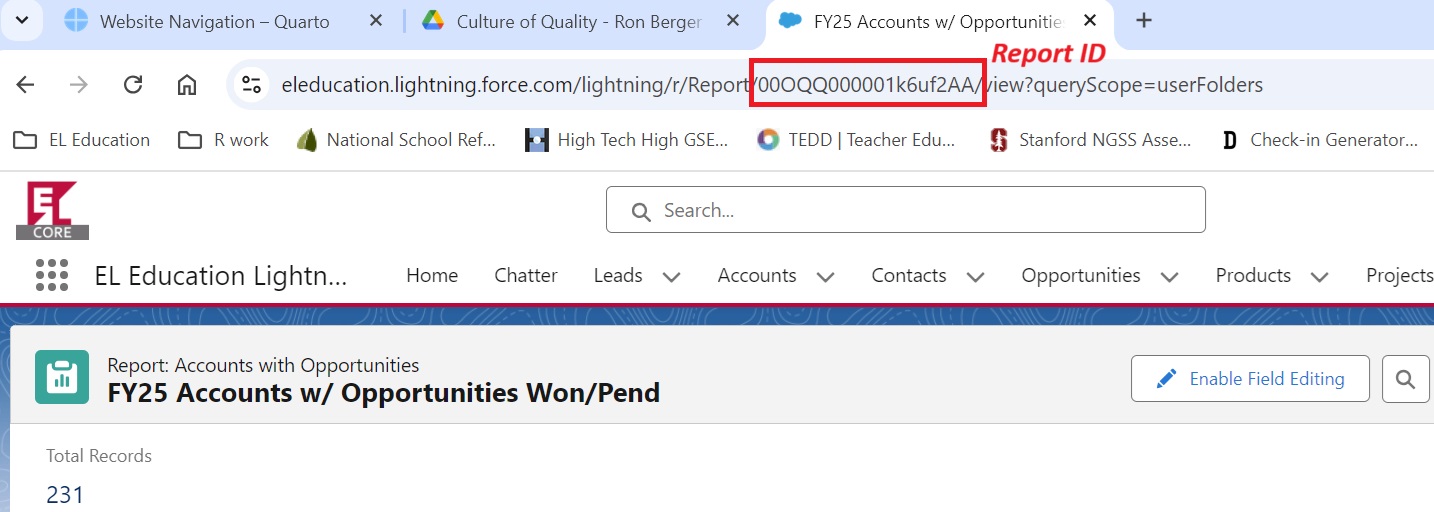
The easiest way to get data from Salesforce to R is through the sf_run_report command, which will take a report from Salesforce and download it as a dataset.
Steps to import a dataset into Salesforce as follows (note that the links and code below will only work for EL employees with the correct Salesforce Credentials):

Other than Dimensions, where dataframes must be pulled manually from the back-end, we also gather data using two other survey platforms that have packages built in R for automated access. Each one allows you to find and pull survey data all from within R.
As a note, the data that each survey platform pulls may not be tidy as regards your use of the data, as each row is a survey entry, as opposed to an answer to a singular question. Understanding how pivots work will allow you to easily reframe the data if necessary for analysis and visualization.
Note - the instructions for each platform require you to have an access token or other method of authorization within Survey Monkey or Qualtrics. Please see someone on the research team to discuss your data needs and gain access.
The svmkR package was developed by Survey Monkey as an interface for R. It can technically create surveys as well as download them, but we are far more interested in using it to grab information from surveys that already exist.
Steps to use as follows:
1. Run the following code with the token provided by someone on the Research Team. You only need to run this once, as it will install the package and provide the access token.
## If the following does not run, it means that you also need to install devtools using
## install.packages("devtools")

devtools::install_github("soubhikbarari/svmkR")
usethis::edit_r_profile()
## this will open up an R Profile where you can save your passwords. Paste the following inside this and save:
options(sm_oauth_token = "ACCESSTOKEN")To learn more about this package, see the documentation here
The qualtRics package was developed by the rOpenSci community in order to foster more reproducible and open systems for data analysis. In order to use it, you will need a token that is particular to your account in Qualtrics. You can find and use it by doing the following:
After logging into EL’s Qualtrics portal, click on your initals in the top right to access “Account Settings”. If you scroll down, you should see “Token” with a long string of characters (and if not, you can click “Generate Token” to create one). You will need that string of characters below.
Run the following to install the package and set the token.
install.packages("qualtRics")
library(qualtRics)

qualtrics_api_credentials(api_key = "TOKENFROMSTEP1",
                          base_url = "eleducation.qualtrics.com",
                          install = TRUE)

## Only run the following if you immediately wish to use the Qualtrics platform - it will reload R using the credentials that were just placed there
readRenviron("~/.Renviron")